Mars Hydro FC6500 PPFD & PAR Data
Mars Hydro · FC6500 · Grow
The numbers below are compiled from public sources: Mars Hydro’s own specifications and an independent PAR test by Coco for Cannabis. They are not our own measurements. Each row says where the value came from.
A note on which FC6500 this is
Mars Hydro sells the FC6500 in more than one trim: an older 650 W version and a newer “EVO” / Smart FC6500 rated around 730 W. The manufacturer figures in the first table are for the 650 W spec sheet. The independent test unit drew ~710 W at full power, which is closer to the higher-wattage trim, so treat the two tables as reference points from slightly different hardware rather than the same unit measured two ways.
Manufacturer stated (650 W spec sheet)
| Metric | Manufacturer stated | Source |
|---|---|---|
| Rated power draw | 650 W (±5% @120V) | hydro-lite.com FC-6500 650W |
| PPF | 1813 µmol/s | hydro-lite.com FC-6500 650W |
| PPE (efficacy) | 2.8 µmol/J | hydro-lite.com FC-6500 650W |
| Coverage (core) | 5×5 ft | hydro-lite.com FC-6500 650W |
The 1813 µmol/s figure is listed on the retailer spec sheet as “average PPFD,” but the unit (µmol/s, not µmol/m²/s) is total photon flux (PPF), not PPFD. We report it as PPF to avoid propagating the mislabel.
Independent PAR test (Coco for Cannabis)
Coco for Cannabis re-ran Mars Hydro’s test conditions with an Apogee sensor and a 5×5 ft grid. These are true area PPFD numbers, so they are the most useful ones on this page.
| Condition (height / power) | Max PPFD | Average PPFD | Corner (min) PPFD | Measured draw | Source |
|---|---|---|---|---|---|
| 48 cm (19 in) / 100%, 5×5 ft | 1040 µmol/m²/s | 737.7 µmol/m²/s | 524 µmol/m²/s | 710 W | cocoforcannabis.com |
| 30 cm (12 in) / 100%, 4×4 ft (CO₂ grows) | 1257 µmol/m²/s | not stated | not stated | 710 W | cocoforcannabis.com |
| 36 cm (14 in) / ~80%, 4×4 ft | 1000 µmol/m²/s | not stated | not stated | 565 W | cocoforcannabis.com |
Manufacturer vs measured (comparable line)
| Metric | Manufacturer stated | Third-party measured | Notes |
|---|---|---|---|
| Efficacy | 2.8 µmol/J | 2.45 µmol/J (ePPE) | Coco reports 1740 µmol usable ePPF ÷ 710 W |
| Coverage | 5×5 ft “core” | Corners drop to 524 µmol/m²/s at 19 in / 100% | Usable as 5×5 for veg; denser for flower closer in |
PPFD map (per grid position) — manufacturer chart
Manufacturer stated, transcribed from Mars Hydro’s official “NEW FC 6500 PPFD MAP” image, tested in a 5×5 ft (150×150 cm) tent at three hanging heights (8 in, 12 in, 16 in). The map is a full 10×10 grid of µmol/m²/s readings. These are Mars Hydro’s own printed figures read off its chart, hosted on the hydro-lite.com retailer listing (map image); they are not our measurement.
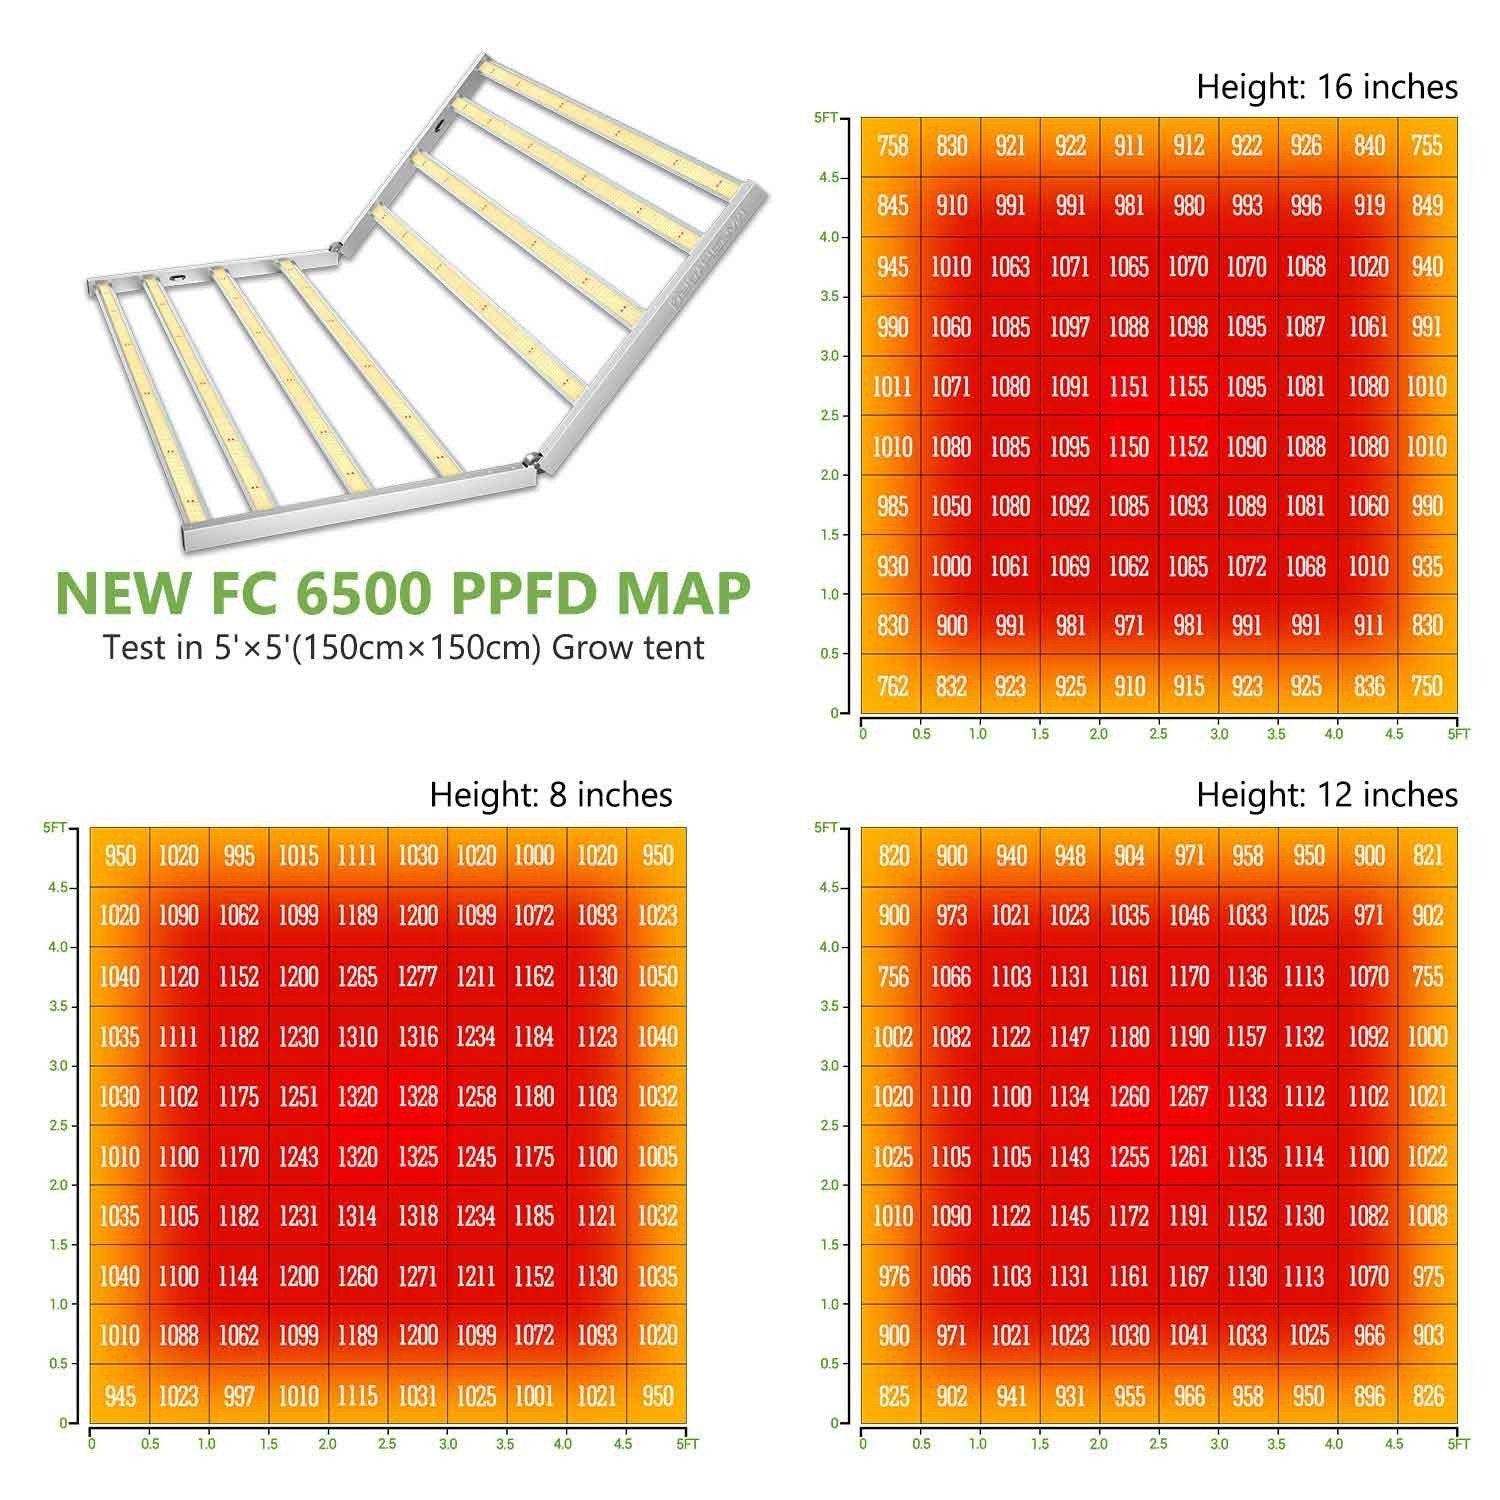
Each column header is the grid position along the 5 ft width (ft, cell centers); rows run from the back of the tent (4.75 ft) to the front (0.25 ft). All values µmol/m²/s.
Height: 8 inches
| y ↓ \ x → | 0.25 | 0.75 | 1.25 | 1.75 | 2.25 | 2.75 | 3.25 | 3.75 | 4.25 | 4.75 |
|---|---|---|---|---|---|---|---|---|---|---|
| 4.75 | 950 | 1020 | 995 | 1015 | 1111 | 1030 | 1020 | 1000 | 1020 | 950 |
| 4.25 | 1020 | 1090 | 1062 | 1099 | 1189 | 1200 | 1099 | 1072 | 1093 | 1023 |
| 3.75 | 1040 | 1120 | 1152 | 1200 | 1265 | 1277 | 1211 | 1162 | 1130 | 1050 |
| 3.25 | 1035 | 1111 | 1182 | 1230 | 1310 | 1316 | 1234 | 1184 | 1123 | 1040 |
| 2.75 | 1030 | 1102 | 1175 | 1251 | 1320 | 1328 | 1258 | 1180 | 1103 | 1032 |
| 2.25 | 1010 | 1100 | 1170 | 1243 | 1320 | 1325 | 1245 | 1175 | 1100 | 1005 |
| 1.75 | 1035 | 1105 | 1182 | 1231 | 1314 | 1318 | 1234 | 1185 | 1121 | 1032 |
| 1.25 | 1040 | 1100 | 1144 | 1200 | 1260 | 1271 | 1211 | 1152 | 1130 | 1035 |
| 0.75 | 1010 | 1088 | 1062 | 1099 | 1189 | 1200 | 1099 | 1072 | 1093 | 1020 |
| 0.25 | 945 | 1023 | 997 | 1010 | 1115 | 1031 | 1025 | 1001 | 1021 | 950 |
Height: 12 inches
| y ↓ \ x → | 0.25 | 0.75 | 1.25 | 1.75 | 2.25 | 2.75 | 3.25 | 3.75 | 4.25 | 4.75 |
|---|---|---|---|---|---|---|---|---|---|---|
| 4.75 | 820 | 900 | 940 | 948 | 904 | 971 | 958 | 950 | 900 | 821 |
| 4.25 | 900 | 973 | 1021 | 1023 | 1035 | 1046 | 1033 | 1025 | 971 | 902 |
| 3.75 | 756 | 1066 | 1103 | 1131 | 1161 | 1170 | 1136 | 1113 | 1070 | 755 |
| 3.25 | 1002 | 1082 | 1122 | 1147 | 1180 | 1190 | 1157 | 1132 | 1092 | 1000 |
| 2.75 | 1020 | 1110 | 1100 | 1134 | 1260 | 1267 | 1133 | 1112 | 1102 | 1021 |
| 2.25 | 1025 | 1105 | 1105 | 1143 | 1255 | 1261 | 1135 | 1114 | 1100 | 1022 |
| 1.75 | 1010 | 1090 | 1122 | 1145 | 1172 | 1191 | 1152 | 1130 | 1082 | 1008 |
| 1.25 | 976 | 1066 | 1103 | 1131 | 1161 | 1167 | 1130 | 1113 | 1070 | 975 |
| 0.75 | 900 | 971 | 1021 | 1023 | 1030 | 1041 | 1033 | 1025 | 966 | 903 |
| 0.25 | 825 | 902 | 941 | 931 | 955 | 966 | 958 | 950 | 896 | 826 |
Height: 16 inches
| y ↓ \ x → | 0.25 | 0.75 | 1.25 | 1.75 | 2.25 | 2.75 | 3.25 | 3.75 | 4.25 | 4.75 |
|---|---|---|---|---|---|---|---|---|---|---|
| 4.75 | 758 | 830 | 921 | 922 | 911 | 912 | 922 | 926 | 840 | 755 |
| 4.25 | 845 | 910 | 991 | 991 | 981 | 980 | 993 | 996 | 919 | 849 |
| 3.75 | 945 | 1010 | 1063 | 1071 | 1065 | 1070 | 1070 | 1068 | 1020 | 940 |
| 3.25 | 990 | 1060 | 1085 | 1097 | 1088 | 1098 | 1095 | 1087 | 1061 | 991 |
| 2.75 | 1011 | 1071 | 1080 | 1091 | 1151 | 1155 | 1095 | 1081 | 1080 | 1010 |
| 2.25 | 1010 | 1080 | 1085 | 1095 | 1150 | 1152 | 1090 | 1088 | 1080 | 1010 |
| 1.75 | 985 | 1050 | 1080 | 1092 | 1085 | 1093 | 1089 | 1081 | 1060 | 990 |
| 1.25 | 930 | 1000 | 1061 | 1069 | 1062 | 1065 | 1072 | 1068 | 1010 | 935 |
| 0.75 | 830 | 900 | 991 | 981 | 971 | 981 | 991 | 991 | 911 | 830 |
| 0.25 | 762 | 832 | 923 | 925 | 910 | 915 | 923 | 925 | 836 | 750 |
Read across the heights: at 8 in the center peaks around 1320 but the corners sit near 950; raising to 16 in flattens the whole field into the 750–1150 band (a more uniform canopy at lower peak). Every cell above is Mars Hydro’s stated figure off its own chart — the useful cross-check is that the independent Coco for Cannabis test (5×5 ft, 19 in) puts real average PPFD at ~738 and corners at 524, below the manufacturer’s 16 in corners of ~750, which is the usual gap between a vendor map and a metered bench test.
Sources
- Manufacturer specs (FC-6500 650 W): https://hydro-lite.com/products/mars-hydro-fc-6500-650w
- Official PPFD map image transcribed for the grid tables: https://hydro-lite.com/cdn/shop/products/marshydrofc6500ppfd.jpg
- Independent PAR test (Coco for Cannabis): https://www.cocoforcannabis.com/grow-light-guide/mars-hydro-fc-6500-par-test-and-review/
Notes
The measured efficacy (2.45 µmol/J from usable photons over the footprint) runs below the 2.8 µmol/J spec, which is normal: the spec is a raw fixture number and the test figure counts only photons landing inside the grid. The corner reading (524 µmol/m²/s) is the honest limit of the 5×5 ft claim at 19 in and full power; lowering the light or the coverage area raises it.