Mars Hydro TS1000 PPFD & PAR Data
Mars Hydro · TS1000 · Grow
The numbers below are compiled from public sources: Mars Hydro’s own product listing and PPFD map, and an independent PAR test. They are not our own measurements. Where a figure is only a manufacturer claim, or only an image we read as text, it is labelled that way. Each row says where the value came from.
What Mars Hydro publishes
Mars Hydro lists the TS1000 as a 150 W fixture and publishes an official PPFD map on the product page. That map is only an image — the grid values are not offered as text anywhere on the site — but the image itself is labelled with the hanging heights (12 in, 16 in and 18 in) and prints a µmol/m²/s number at every grid position, tested in a small grow tent. We transcribe those printed numbers below. They are Mars Hydro’s own stated figures, read off its own chart image; they are not our measurement.
| Metric | Manufacturer stated | Source |
|---|---|---|
| Rated power draw | 150 W | marshydro.eu |
| PPF | 330 µmol/s (claim, per third-party review) | cocoforcannabis.com |
| PPE (efficacy) | 2.3 µmol/J | marshydro.eu |
| Coverage (veg) | 2.5×2.5 ft (80×80 cm) | marshydro.eu |
| Coverage (flower) | 2.3×2.3 ft (70×70 cm) | marshydro.eu |
Mars Hydro’s own listing states the efficacy as 2.3 µmol/J; a third-party review cites the manufacturer claim as 2.1–2.35 µmol/J and the PPF claim as 330 µmol/s. Mars Hydro does not publish a PPF figure as plain text on the current EU listing, so the PPF row above is the number the reviewer attributes to Mars Hydro, not a value we read off the site.
Independent PAR test
The most rigorous public third-party datapoint we could find is the Coco for Cannabis field test. It measures the fixture on a bench and reports an average PPFD over a footprint rather than a full grid.
| Metric | Manufacturer stated | Third-party measured | Source (measured) |
|---|---|---|---|
| Wall power draw | 150 W | 146.7 W | cocoforcannabis.com |
| PPF | 330 µmol/s (claim) | 242.1 µmol/s | cocoforcannabis.com |
| Efficacy | 2.3 µmol/J | 1.65 µmol/J | cocoforcannabis.com |
| Average PPFD over footprint | not stated per-area | 673 µmol/m²/s | cocoforcannabis.com |
PPFD map (per grid position) — manufacturer chart
Manufacturer stated, transcribed from Mars Hydro’s official TS1000 PPFD map image (product page, map file mars-hydro-ts1000-ppfd-map.jpg), tested in a 2.5×2.5 ft (80×80 cm) grow tent. These are Mars Hydro’s figures read off its own chart, not our measurement. The chart is a plain 4×4 grid of readings over the tent floor, given at three hanging heights. The grid axes run from 0.5 to 2.5 ft on each side; the top row is the far edge of the tent, the bottom row the near edge.
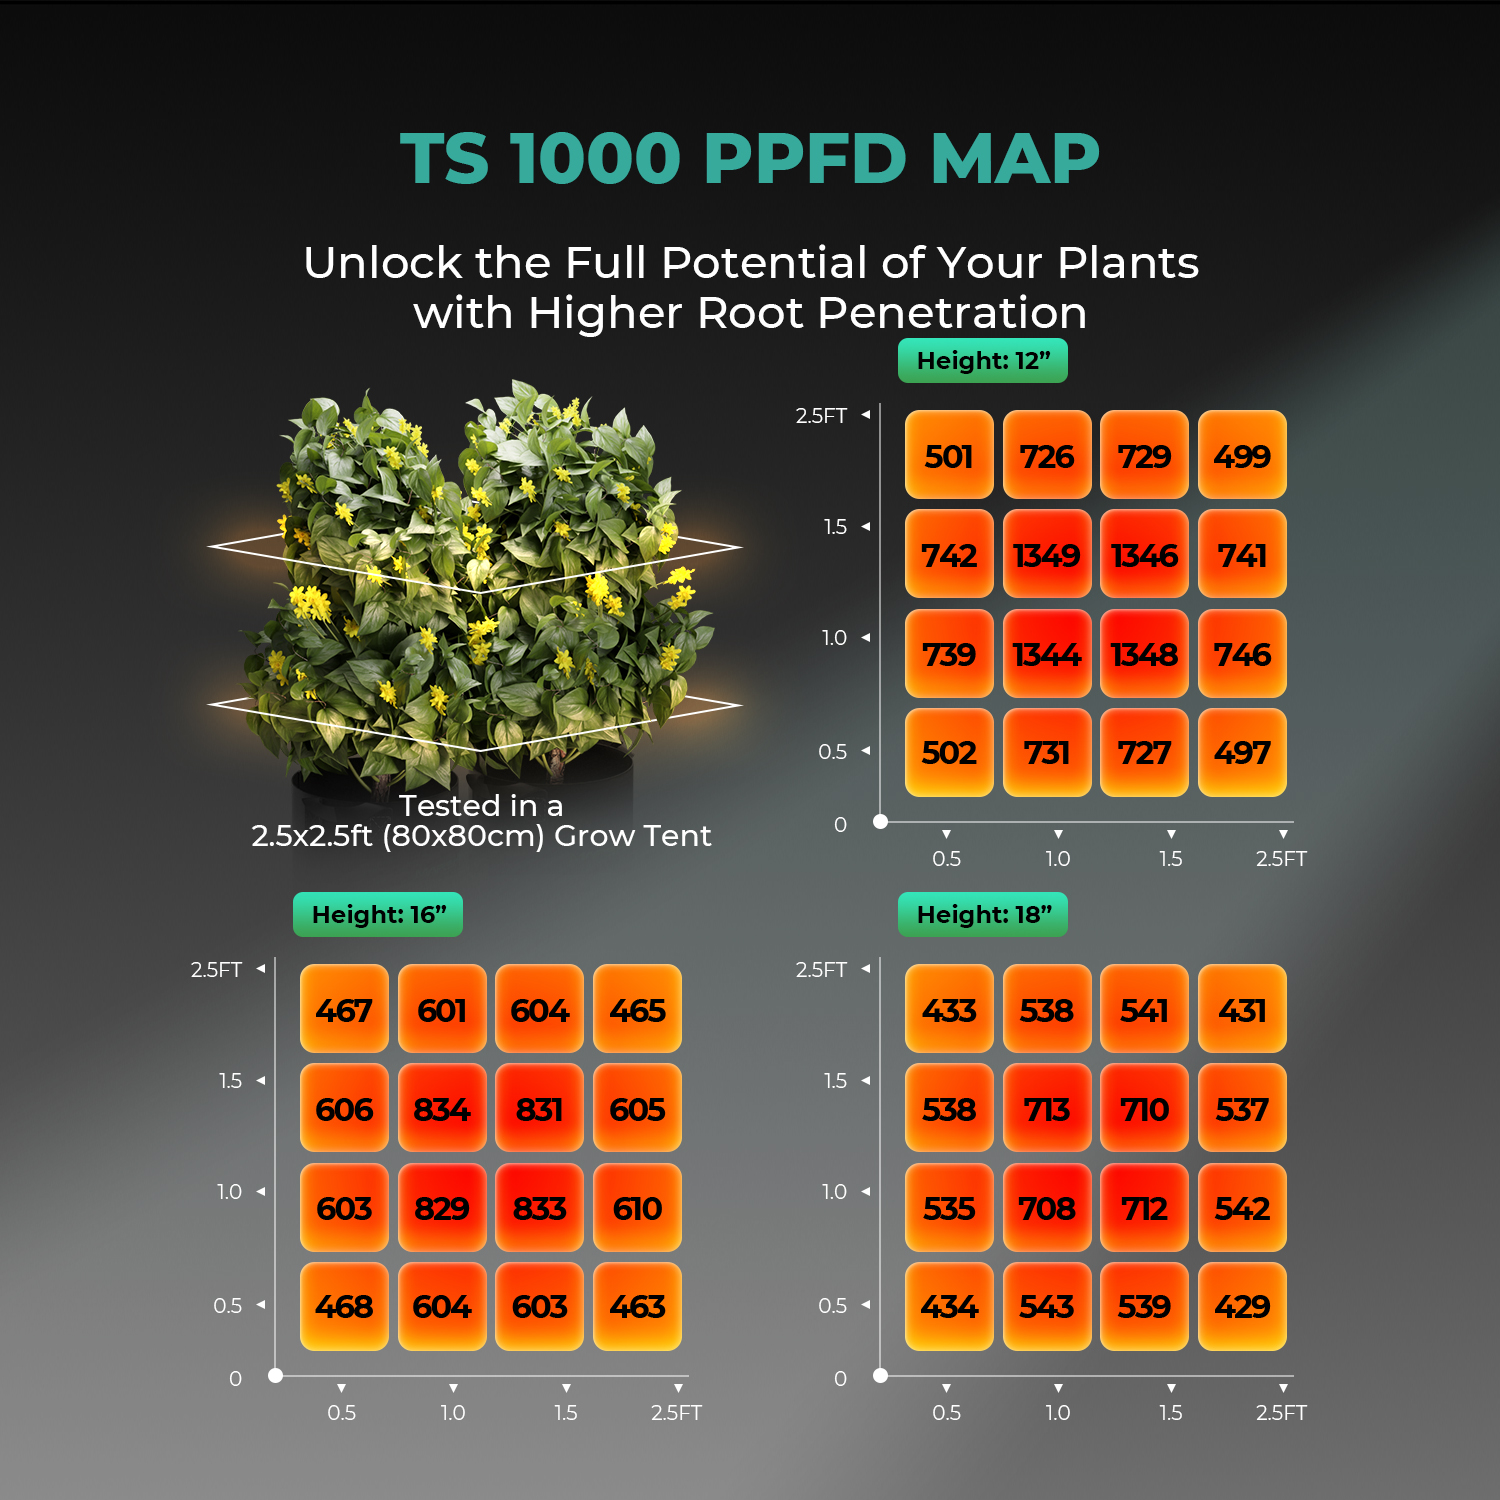
Height: 12 inches
| Row (front → back) | 0.5 ft | 1.0 ft | 1.5 ft | 2.5 ft |
|---|---|---|---|---|
| Back (2.5 ft) | 501 | 726 | 729 | 499 |
| 1.5 ft | 742 | 1349 | 1346 | 741 |
| 1.0 ft | 739 | 1344 | 1348 | 746 |
| Front (0.5 ft) | 502 | 731 | 727 | 497 |
Height: 16 inches
| Row (front → back) | 0.5 ft | 1.0 ft | 1.5 ft | 2.5 ft |
|---|---|---|---|---|
| Back (2.5 ft) | 467 | 601 | 604 | 465 |
| 1.5 ft | 606 | 834 | 831 | 605 |
| 1.0 ft | 603 | 829 | 833 | 610 |
| Front (0.5 ft) | 468 | 604 | 603 | 463 |
Height: 18 inches
| Row (front → back) | 0.5 ft | 1.0 ft | 1.5 ft | 2.5 ft |
|---|---|---|---|---|
| Back (2.5 ft) | 433 | 538 | 541 | 431 |
| 1.5 ft | 538 | 713 | 710 | 537 |
| 1.0 ft | 535 | 708 | 712 | 542 |
| Front (0.5 ft) | 434 | 543 | 539 | 429 |
All values in µmol/m²/s. Every cell in the map read cleanly, so none is marked unverified. Mars Hydro serves two versions of this same map image with identical grid numbers but different tent-size labels — one prints “2.5×2.5 ft (80×80 cm)” and axes to 2.5 ft, the other “2.3×2.3 ft (70×70 cm)” and axes to 2.0 ft. The values are the same in both; the tent-size caption is the only thing that changes, which lines up with the split veg/flower coverage claim. The four inner cells are the hot core (~1340–1350 at 12 in) and the four corners fall to ~500 at 12 in. Raising the light from 12 to 18 in drops the core to ~710 and lifts the corners toward ~430, trading peak intensity for a flatter spread.
Sources
- Manufacturer specs and PPFD map (product page): https://marshydro.eu/products/mars-hydro-ts-1000-led-grow-light/
- Official PPFD map image transcribed for the grid tables: https://img.marshydro.eu/wp-content/uploads/2021/07/mars-hydro-ts1000-ppfd-map.jpg
- Independent PAR test (Coco for Cannabis field test): https://www.cocoforcannabis.com/grow-light-guide/mars-hydro-ts-1000-field-test-review/
Notes
The measured wall draw (146.7 W) sits just under the rated 150 W. The gap that matters is photon output: Mars Hydro’s map is a normalised light-distribution chart with a hot core well above 1000 µmol/m²/s at 12 in, while the bench test measures 242.1 µmol/s of usable PPF and an average of 673 µmol/m²/s over the footprint — and derives 1.65 µmol/J efficacy against a claimed 2.3 µmol/J. A map that peaks over 1300 in the centre and a footprint that averages ~670 are not in conflict: the map shows the best-case centre spots, the average folds in the far weaker corners a real canopy also has to fill. The corners on the 12 in map drop to ~500 µmol/m²/s, roughly a third of the core, which is the honest limit of the 2.5×2.5 ft veg claim.