Spider Farmer G8600 PPFD & PAR Data
Spider Farmer · G8600 · Grow
The numbers below are compiled from Spider Farmer’s own specification page and its published PPFD map. They are not our own measurements. Where a figure is only a manufacturer claim, or only an image we read off by eye, it is labelled that way. Each row says where the value came from.
What Spider Farmer publishes
Spider Farmer lists the G8600 as an 800 W six-bar fixture and publishes an official PPFD map on the product page. That map is only an image — the grid values are not offered as text anywhere on the site — but the image is labelled with the hanging heights (8 in and 12 in), the dimming level (100%), and prints a µmol/m²/s number at every position of an 8×8 grid, tested in a 4×4 ft (120×120 cm) tent. We transcribe those printed numbers below. They are Spider Farmer’s own stated figures, read off its own chart image; they are not our measurement.
| Metric | Manufacturer stated | Source |
|---|---|---|
| Rated power draw | 800 W (±5%) | spider-farmer.com |
| PPF | 2283 µmol/s | spider-farmer.com |
| PPE (efficacy) | 2.85 µmol/J | spider-farmer.com |
| Coverage (standard) | 4×4 ft | spider-farmer.com |
| Coverage (max) | 5×5 ft | spider-farmer.com |
Independent test
We could not locate a rigorous independent bench test (measured wall draw, efficacy and per-position PAR) for the G8600 specifically. Third-party PAR data exists for other Spider Farmer models but not, as far as we found, for this one. This page therefore carries manufacturer figures only; if an independent test surfaces later it will be added as a second column, the same way the SF2000 and SF4000 pages set a measured column next to the manufacturer claim.
PPFD map (per grid position) — manufacturer chart
Manufacturer stated, transcribed from Spider Farmer’s official G8600 PPFD map image (product page, map file Spider-Farmer-800W-G8600-PPFD), tested in a 4×4 ft (120×120 cm) tent at 100% dimming. These are Spider Farmer’s figures read off its own chart, not our measurement. The chart is a plain 8×8 grid, so we reproduce it as an 8-column, 8-row table. Columns run left to right across the 4 ft width; rows run back to front across the 4 ft depth.
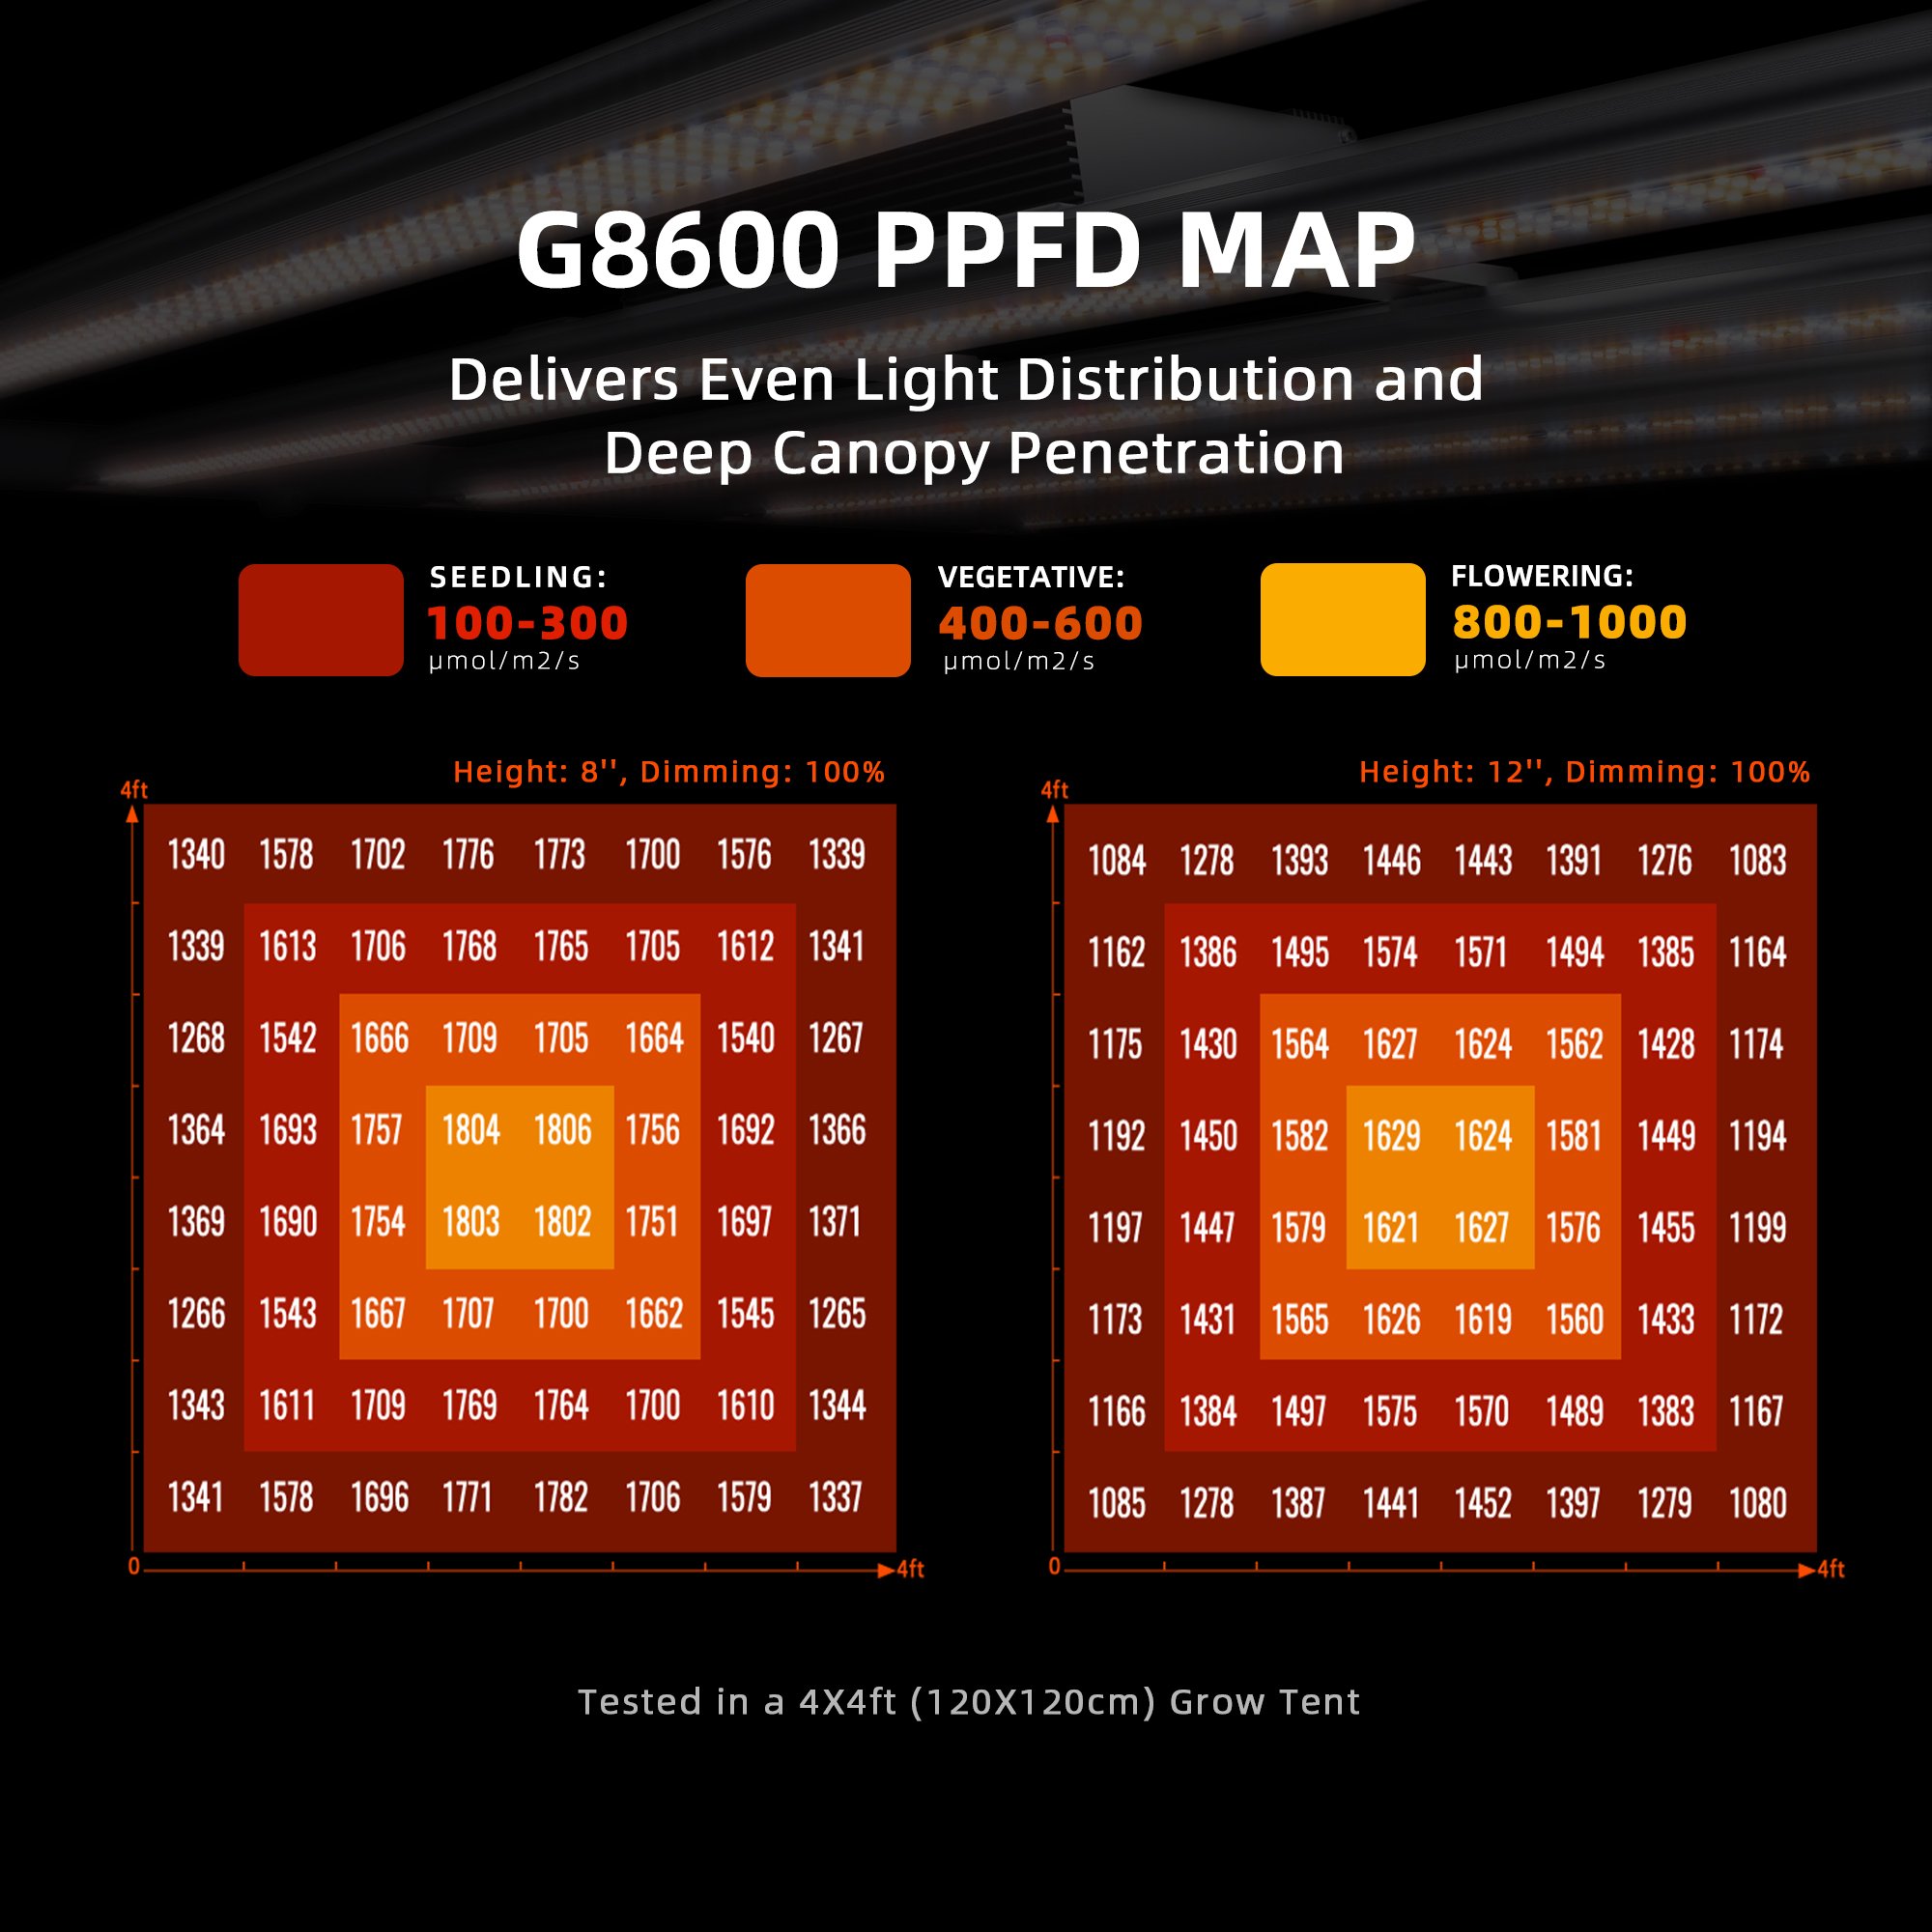
Height: 8 inches, dimming 100%
| Row | C1 | C2 | C3 | C4 | C5 | C6 | C7 | C8 |
|---|---|---|---|---|---|---|---|---|
| 1 | 1340 | 1578 | 1702 | 1776 | 1773 | 1700 | 1576 | 1339 |
| 2 | 1339 | 1613 | 1706 | 1768 | 1765 | 1705 | 1612 | 1341 |
| 3 | 1268 | 1542 | 1666 | 1709 | 1705 | 1664 | 1540 | 1267 |
| 4 | 1364 | 1693 | 1757 | 1804 | 1806 | 1756 | 1692 | 1366 |
| 5 | 1369 | 1690 | 1754 | 1803 | 1802 | 1751 | 1697 | 1371 |
| 6 | 1266 | 1543 | 1667 | 1707 | 1700 | 1662 | 1545 | 1265 |
| 7 | 1343 | 1611 | 1709 | 1769 | 1764 | 1700 | 1610 | 1344 |
| 8 | 1341 | 1578 | 1696 | 1771 | 1782 | 1706 | 1579 | 1337 |
Height: 12 inches, dimming 100%
| Row | C1 | C2 | C3 | C4 | C5 | C6 | C7 | C8 |
|---|---|---|---|---|---|---|---|---|
| 1 | 1084 | 1278 | 1393 | 1446 | 1443 | 1391 | 1276 | 1083 |
| 2 | 1162 | 1386 | 1495 | 1574 | 1571 | 1494 | 1385 | 1164 |
| 3 | 1175 | 1430 | 1564 | 1627 | 1624 | 1562 | 1428 | 1174 |
| 4 | 1192 | 1450 | 1582 | 1629 | 1624 | 1581 | 1449 | 1194 |
| 5 | 1197 | 1447 | 1579 | 1621 | 1627 | 1576 | 1455 | 1199 |
| 6 | 1173 | 1431 | 1565 | 1626 | 1619 | 1560 | 1433 | 1172 |
| 7 | 1166 | 1384 | 1497 | 1575 | 1570 | 1489 | 1383 | 1167 |
| 8 | 1085 | 1278 | 1387 | 1441 | 1452 | 1397 | 1279 | 1080 |
All values in µmol/m²/s. The chart’s own legend bands PPFD as seedling 100–300, vegetative 400–600, and flowering 800–1000 µmol/m²/s. Every cell on both maps sits well above that flowering band: at 8 in the grid runs from about 1265 at the corners to 1806 at the center, and at 12 in from about 1080 to 1629. In other words, at 100% power over a 4×4 ft area this fixture puts down far more light than a flowering canopy needs, so the map is really an argument for running it dimmed or hung higher. Raising it from 8 to 12 in drops the center from ~1806 to ~1629 and flattens the corner-to-center spread, which is the trade the two panels are meant to show.
Sources
- Manufacturer specs and PPFD map (product page): https://www.spider-farmer.com/products/spider-farmer-g860w-led-grow-light/
- Official PPFD map image transcribed for the grid tables: https://www.spider-farmer.com/wp-content/uploads/2022/05/Spider-Farmer-800W-G8600-Full-Spectrum-Led-Grow-Light-PPFD.jpg
Notes
Both panels on the chart are taken at 100% dimming, which is why every reading is above the flowering band; the useful takeaway is the shape of the distribution, not the raw level. The map is close to symmetric front-to-back and left-to-right, and the corner-to-center ratio is tight for a fixture this size (corners around 70–75% of center), which is consistent with the “even distribution” claim for a six-bar layout. The manufacturer’s 2.85 µmol/J efficacy is a fixture-level photon-flux figure; without an independent bench test for this model we cannot set a measured number beside it, so the efficacy and PPF rows above should be read as manufacturer claims rather than verified results.